Data Roundup and Dig : Inflation, Wages, Social Security and Medicare, and a Hawkish Fed
Higher inflation and solid job growth point to a strong U.S. economy while federal fiscal irresponsibility is becoming harder to ignore, all of which bodes poorly for lower interest rates

May 2026 economic data reported over the past few weeks embody the consumer price impact of the Iran war. Inflation is now over four percent and near three percent without food and energy. The job market has rebounded nicely, but real wages are not keeping pace with the upward price movement. Recent reports regarding the financial resources of Social Security and Medicare portend intractable fiscal challenges for the federal government.
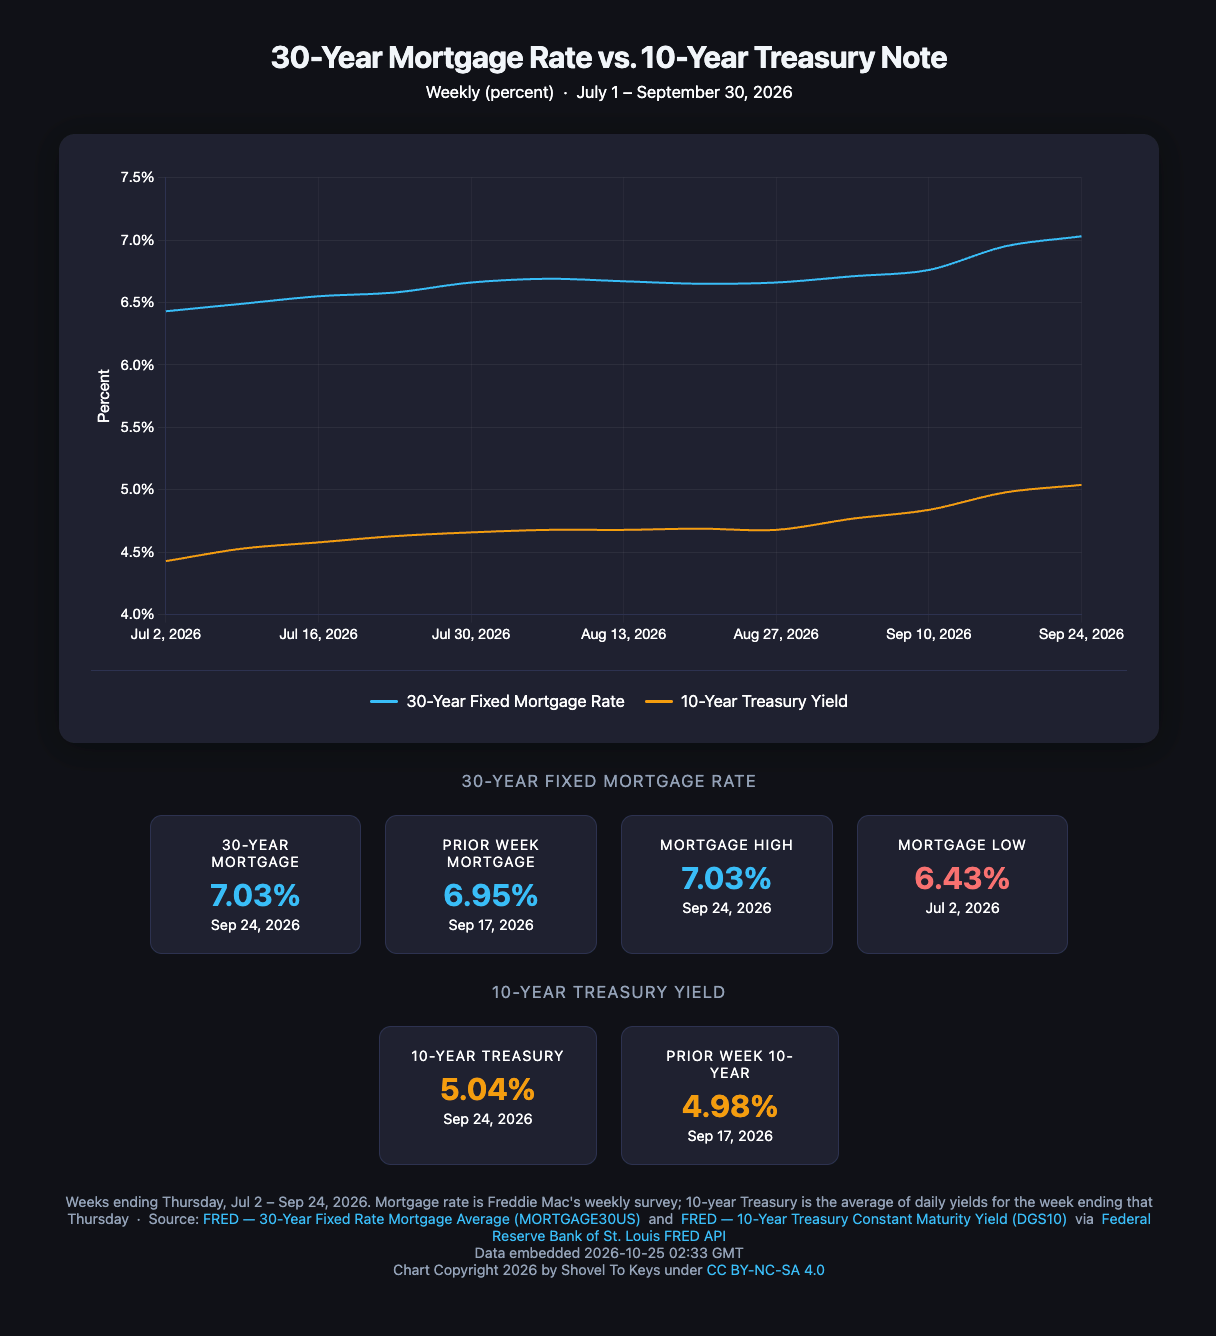
The admixture of these economic forces likely will raise the pressure on the Federal Reserve to hike, not cut, the benchmark Federal Funds rate. A higher rate certainly will not help housing affordability. The ten-year Treasury Note guidepost for mortgage rates will not resume the briefly exciting decline of early 2026 if investors anticipate a Federal Reserve rate hike. In turn, the interest rate on new home mortgages will remain disappointingly elevated in the mid-six percent range after touching just below six percent before the Iran escapade sent inflation skyrocketing.
Now, to the May 2026 data.
Consumer Price Index
-
The CPI for All Items was up 4.2% year-over-year in May 2026 compared to 2.38% one year ago.
- CPI was last near this level (4.13%) in May 2023 as inflation descended from its Covid pandemic surge.
- Excluding the pandemic, inflation last hit 4.0% between September and October 2008.
- The index rose 0.5% from April to May after rising 0.6% in April and 0.9% in March. From February to March, the CPI rose 0.3%.
- Even excluding food and energy (as though consumers do not eat or drive), the CPI in May rose 2.9% year-over-year.
-
The CPI for Shelter only has not been as volatile but consistently exceeds All Items inflation.
- In May 2026, the Shelter CPI jumped 3.4% from the prior year.
- The May 2026 month-to-month increase was 0.3% after rising 0.6% in April and 0.3% in March.
- The Shelter CPI has been above 3.0% since September 2021.
- Excluding the brief housing cost depression in the early days of Covid, the CPI Shelter rate has been consistently at or above 3.0% since June 2014.
-
Since January 2009 when the Great Financial Crisis fully gripped the United States, CPI for Shelter has outpaced overall CPI by an average of 0.69 percentage points with CPI All Items averaging 2.44% and Shelter averaging 3.13%.
- At the Shelter CPI, monthly median rent in June 2026 rose to $1,443 but would have been $1,283 at the CPI All Items rate.
- The impact on monthly median rent of the 0.69% gap between All Items and Shelter CPI as measured by the Census Bureau has been $160 based on a median rent in January 2009 of $842.
Some of you may be concerned about inflation over 4% and core inflation (without food and energy) near 3%. Until recently, Shovel to Keys shared your concern, but maybe our perspective was misguided. Inflation at twice the Federal Reserve target rate apparently is a number to be loved.
Real Wages
Each month, the Bureau of Labor Statistics publishes its calculation of the “real” average wage earned by American workers. The BLS math begins with the average hourly earnings measured a bit over 40 years ago. To this base hourly wage, the BLS applies two adjustments — the nominal rise in wages and inflation in the form of the CPI that it calculates (discussed above). The result is a measure of how wages in the reporting period compare to wages in 1984.
The “nominal” change in wages is the actual dollar and cents amount that wages rose (or in rare instances fell, such as during the Covid pandemic). The “real” earnings change is the nominal change adjusted downward (or upward in the case of a deflationary time in the economy) by the eroding effect of inflation. A falling real earnings trend indicates that wage increases are not keeping pace with inflation.
In the chart above (which we know is small), we show the history of nominal average weekly earnings (blue) since 2007 alongside the CPI (orange). We then plot real average weekly earnings (purple) (that is, the nominal earnings adjusted by CPI). Last, we add our own real average weekly earnings calculation by adjusting nominal earnings with the CPI for Shelter (turquoise), which we will call Shelter Inflation Adjusted Real Earnings (“SIARE”).
From three years beginning in April 2022, the SIARE was persistently negative. Nominal wages were not keeping pace with the inflation in housing cost measured by CPI for shelter. When inflation spiked after the huge pandemic-driven infusion of cash into the economy, the SIARE dove deeply negative to as low as -4.11% in March 2023. The plot of SIARE is a stark, visual representation of the dramatic decline in housing affordability following the Covid pandemic.
As monetary policy brought down inflation, the SIARE climbed toward zero. In April 2025, the measure crossed into positive territory and then hovered just above zero for a few months. In late 2025, real wages began to gain on shelter costs. Then Cupid’s arrow of love for inflation struck our President, or was it just braggadociousness? Since January 2026, SIARE has nose-dived.
The SIARE shows, we believe, how the rising cost of housing erodes wage gains and has eroded wage gains more rapidly in recent years than overall inflation. Given the long-standing notion that one-third of wages can be devoted to housing costs, when inflation in shelter cost is higher than overall inflation, the one-third arguably must rise. In other words:
- When shelter inflation rises faster than overall inflation, expenditures for shelter force a reduction in expenditures for other items, OR
- If other items expenditures cannot be reduced, then the percentage of financial resources for payment of shelter costs must diminish through a move to lower cost housing or a lease or mortgage default, OR
- Employees experiencing erosion of buying power put upward pressure on employers to raise wages.
These data give us another way to look at and measure housing affordability. The data since March are not encouraging.
Shovel to Keys appreciates your reading attention. Please share this post to help us grow our audience.
Social Security and Medicare
In early June 2026, the Social Security and Medicare Boards of Trustees published an annual report on the financial woes of the Old-Age and Survivors Insurance (commonly known as Social Security) and Hospital Insurance (Medicare Part A) trust funds. To continue a metaphor long used to describe Congressional inaction regarding these trust funds, the road down which the can may be kicked has shortened again. To extend the metaphor, at the end of the shortening road, a dangerously steep slope awaits.
The Board of Trustees reports that the OASI fund will be at zero in about six years by the end of 2032. The Medicare Part A fund will be empty about six months later. Beyond those dates, benefits will drop to 78% and 83%, respectively, and will be funded only by current payroll taxes. The political pressure to dodge these bullets will be immense and almost inevitably lead to a surge in federal government borrowing to fund the benefit gap. The alternative of raising taxes is almost unimaginable in the fiercely divided and closely contested Congress.
As Shovel to Keys wrote a few weeks ago, the exhaustion of these trust funds will occur concurrently with a persistent increase in the federal government’s interest payment obligation on the national debt. The aggregate financial burden of non-discretionary entitlement programs (largely Social Security OASI and Medicare) and interest on the federal debt will propel the United States government to a moment in less than 20 years when “no feasible future additional tax on broad-based labor income” can fund these programs and interest payments.
As the country approaches this moment of insolvency, we can expect investors to demand higher and higher rates of interest on federal borrowing. Investors, unlike Congressional politicians, will read well the clear writing on the wall. Although insolvency may be 20 years or more in our future, the first hint of bond investor concern may already be in view.
Higher interest rates will make debt more expensive for everyone, including aspiring home buyers. Housing affordability will worsen as mortgage rates climb. Investors and builders who create housing will pay higher financing costs, which will force rents and home prices upward. In our national conversation about housing affordability, federal government profligacy should always be at the top of the agenda.
Job Creation and Unemployment
As Spring began to give way to summer, forecasts for job growth in the United States were restrained but optimistic. The Dow Jones consensus estimate for new jobs for May 2026 was 80,000 when the Bureau of Labor Statistics published its Employment Situation report for the month. Forecasts that the jobs data would curtail a Federal Reserve interest rate cut were nowhere to be read.
The warming weather was not the only heat in May. The economy created more than twice the projected number of jobs - 172,000. Unemployment held steady at 4.3%. The April job creation count was revised upward to 179,000 from the 115,000, and the March tally rose 29,000 to 214,000. The last time job creation reached these counts was in December 2024. Employer hiring doubts precipitated by AI productivity uncertainty seemed to have given way to enthusiasm. Smile if you have children who recently graduated from college.
Reaction to the jobs report was consistently upbeat for the economy but downbeat for the effect on Federal Reserve interest rate policy.
The Federal Reserve
With inflation over four percent and unemployment steady and surprising job creation in May 2026, the monetary policy landscape is one not expected when 2026 began. As 2026 emerged from the surprisingly resilient (think tariffs) economy of 2025, Federal Reserve watchers forecast at least one and possibly two interest rate reductions in 2026. Among the members of the Federal Open Market Committee, the 2026 year-end interest rate forecasts bunched between 3.25% and 3.5% about one-quarter point below the current range. The expectation for downward pressure on rates was magnified by the relentless assault by Trump on Federal Reserve Chairman Jerome Powell and Trump’s selection of purported rate dove Kevin Warsh to succeed Powell.
Then the New York Knicks, Carolina Hurricanes, and Bureau of Labor Statistics Employment Situation report disrupted all expectations. Well, they did, but the interest rate disruption could be blamed only on one of them. Inflation spiked because of the Iran War, as explained above, and employers found renewed need to hire workers.
The impact of the war on prices, especially energy prices, and a strong employment turnaround changed the season of the landscape dramatically. After chairing his first meeting of the FOMC, Chairman Warsh demonstrated, at least for the moment, his commitment to Federal Reserve first principles. Not only did the FOMC leave interest rates unchanged, but hawkish comments from Warsh point only toward a possible rate hike in 2026.
The Outlook for Housing Affordability
In the coming months, little optimism is possible for improved housing affordability whether in the form of lower mortgage rates or lower rents. Even after so-called diplomats announced a suspension of hostilities between Iran and the United States and the stock market indexes responded exuberantly, ten-year Treasury Note rates barely moved. Perhaps Treasury investors are a more skeptical lot, but more probably they understand that no war, indeed no single event, likely will alter the course of federal fiscal irresponsibility.
Looking beyond the recent data and the near-future slope of interest rates, we may have good reason to doubt that housing affordability can improve over the coming years through lower interest rates. The ten-year Treasury Note baseline for most home mortgage loans may be attenuating its loyalty to the central bank interest rate. Instead, Treasury Note investors may be focusing more on the growing fiscal challenges for the U.S. government — rapidly increasing debt, entitlement program insolvency, escalating interest expense, and tax revenue reduction caused by the so-called Big Beautiful Bill. Even in a strong economy with a robust stock market, the ten-year rate may not decline.
Whatever the reasons or the relative weights of the reasons, lower interest rates are unlikely to bring cost relief to anyone aspiring to buy a home. Truly addressing affordability (which Congressional grandstanding in the form of the Renewing Opportunity in the American Dream to Housing Act will not do) will become a matter of lowering the price tag of housing or moderating buyer expectations. Look for future Shovel to Keys posts on the 21st Century ROAD to Housing Act and equating housing possibilities with buyer desire.
For a succinct but not surprising summary of the causes of the worsening condition of the trust funds, you need read only the first page of the report — declining birth rate, rapidly aging population, near zero immigration, tax cuts in the One Big Beautiful Bill Act, and higher utilization of some healthcare services.