Financial Rationality Wins
Builders Are Slowing New Home Construction Despite Claims Of A Housing Shortage
Our Charts Are Interactive on ShovelToKeys.com
We do not frequently hurry to write about the most recent data release. Many other writers quickly cover the basic news. Shovel To Keys needs thinking time. The Census Bureau housing starts print for September and released today (October 20, 2026) deserves prompt attention, however.
When writing in late April about March 2026 housing starts, we cautioned that the impact of the Iran War on interest rates could dampen the housing market enthusiasm that emerged from the winter holidays. We later observed that early May was too soon to measure the impact of the war on home sales. Yesterday and today, we received hard data about mortgage applications, builder sentiment, housing starts, and real wages.
Mortgage Applications for the Week Ending October 16
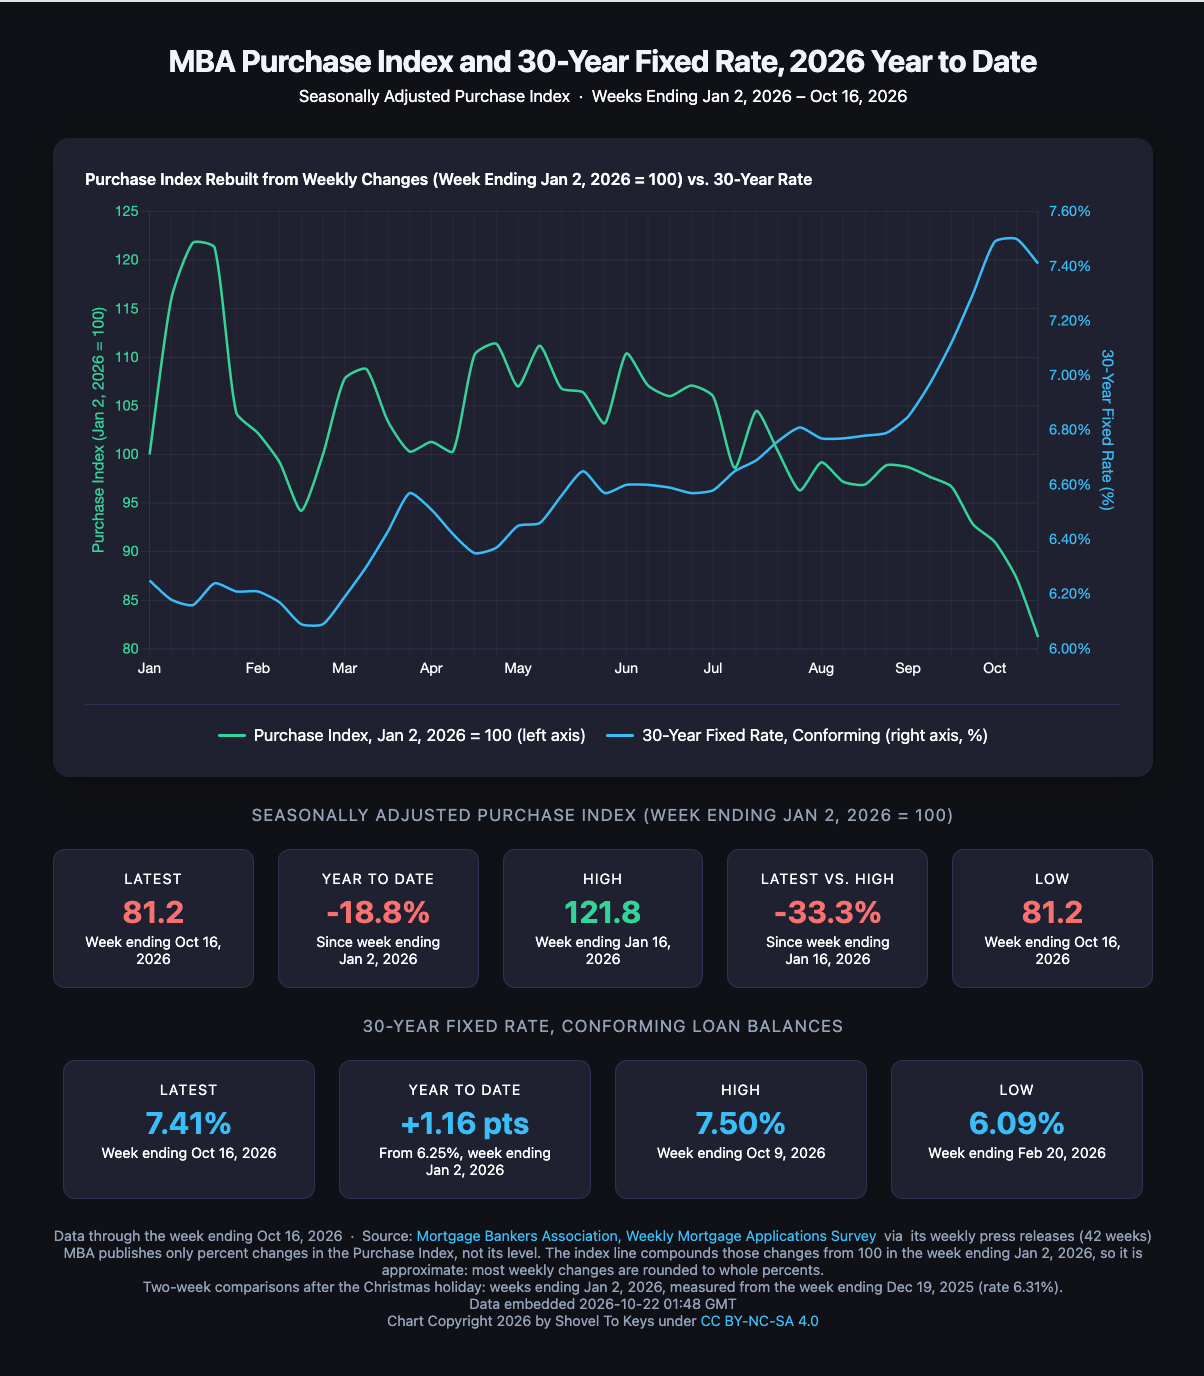
The Mortgage Bankers Association publishes weekly a summary of mortgage applications, drawing on a survey by the Association of mortgage bankers, commercial banks, thrifts, and credit unions. In the week ending October 16, applications for purchase mortgages (i.e., mortgages to buy, not refinance, a home) dropped 4% from the prior week and 16% from one year ago. In the four weeks preceding October 16, the 30-year mortgage rate rose from 7.12% to 7.41% with a peak at 7.50% in the week ending October 9.
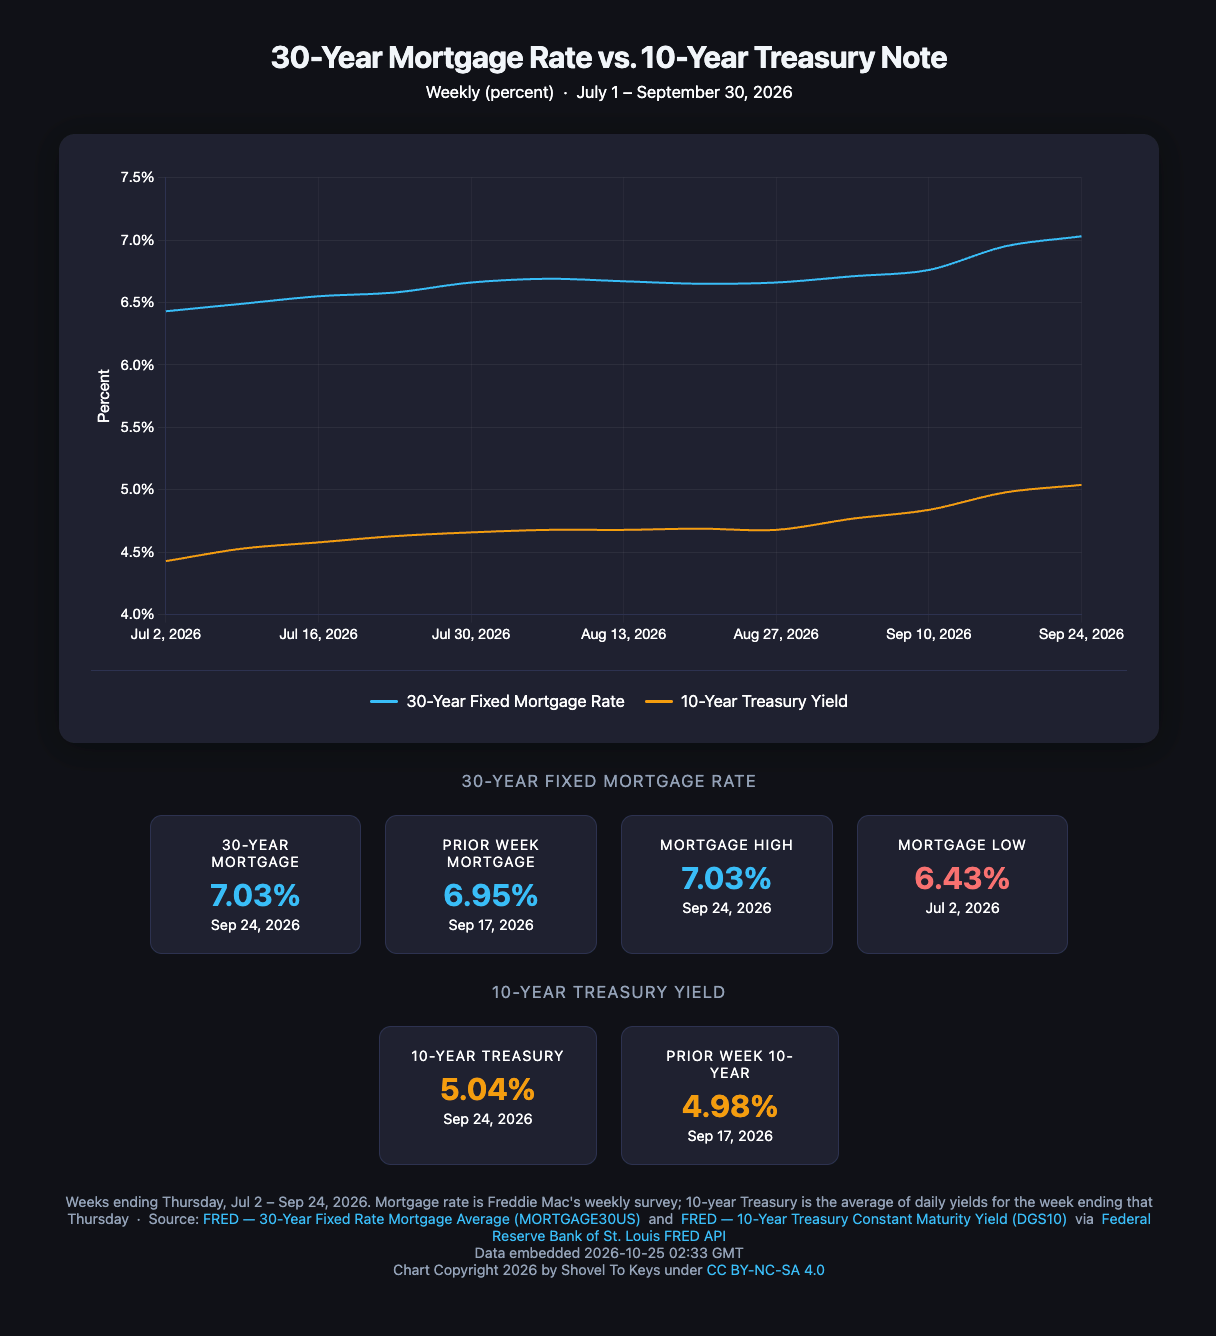
No reader of Shovel To Keys is surprised that a rapid, steep climb in the 30-year mortgage rate correlates with a rapid, steep drop in mortgage applications. In the chart above, notice the inverse relationship, especially when the 30-year mortgage rate moves higher strongly. Mortgage applications for home purchase respond quickly and strongly. The far right portion of the chart shows the response of bond investors to Treasury Secretary Bessent’s claim to be “the house”. Ten-year treasuries rose sharply driving to nearly vertical the slope of the 30-year mortgage rate curve.
The chart below depicts the same relationship in a different, more discrete way. Some of you may find this visualization more intuitive.
The same correlation also prevails from year-to-year. When the 30-year rate in a week is substantially lower than the rate one year earlier, the change in the volume of mortgage applications is strongly positive, and vice versa. Correlation is not causation, and the correlation may be obvious, but the relationship reveals how rapidly the demand for purchasing a home responds to a rising mortgage rate.
Builder Confidence
The National Association of Home Builders and Wells Fargo Bank conduct a monthly survey of home builders. The survey asks builders to assess the state of current sales, the expectation for sales in the coming six months, and the volume of buyer traffic for new single-family homes. The responses are converted to a “Housing Market Index” on a scale of 0 to 100 with 50 drawing the boundary between positive and negative sentiment. October’s HMI illustrates how rapidly builder sentiment responds to buyer demand.
For October 2026, the HMI fell to 29. The September 2026 survey yielded an Index reading of 32. In October 2025, the HMI stood at 37. For context, the HMI dropped to 30 in April 2020 (the month after the Covid Pandemic began in the United States). Excluding the Pandemic, the Index last touched 29 in June 2012, after 60 months consistently below 29 with a low of 8 in January 2009. Home builders are understandably pessimistic.
Housing Starts for September 2026
Pessimism about future sales opportunity does not breed enthusiasm for increasing the production of stuff to be sold. Why build more widgets if potential customers cannot afford to buy the widgets? The U.S. Census Bureau monthly report for new home construction permitting and starts illustrates the inverse relationship between builder sentiment and new home production:
- Non-governmental housing starts (single-family and multi-family) fell in September to 1,221,000, down 5.2% from August and 7.4% from September 2025;
- The year-over-year decline amounts to almost 100,000 housing units annually;
- Single-family starts fell to an annual rate of 859,000, a decline of 4.6% from August (after an 18,000 downward revision in the August number) and up from 837,000 (+2.6%) in September 2025 (but recall that the Census Bureau was closed during the data collection and reporting for September 2025 due to the U.S. government shutdown, and the data was not reported until January 2026);
- Other than September 2025, the single-family starts number was last at or below September 2026’s 859,000 in each of the five months from November 2022 to March 2023 (and remember that the 30-year mortgage rate started 2022 at 3.45% but was 6.90% by October 2022); and
- The 12-month trailing average of single-family starts for the year ending September 2026 was 912,000 down from 963,000 in September 2025.
As we have repeated possibly to the discomfort of our readers, the prevailing theory among academics, policy wonks, and think tanks is that increasing housing supply will lower housing cost. To the contrary, we have written that housing supply will not grow without profit to fertilize the ground on which the housing is built. The Census Bureau housing data proves the point. The steep decline in housing starts in September 2026 speaks to the Shovel to Keys thesis that builders are financially rational (despite distortions induced by Wall Street) and are not the solution to housing affordability unless being the solution is profitable.
And, to Make Matters Just a Bit Worse
Last week, the Bureau of Labor Statistics published its monthly calculation of “real wages” for September 2026. By “real”, the BLS and economists generally mean that the reported data is adjusted for inflation. In the context of wages, the calculation first measures the month-to-month change in wages and then subtracts the monthly Consumer Price Index.
For September 2026, real hourly wages declined by 0.5%. The dismal news for workers flowed from a meager 0.1% increase in hourly wages and a monthly CPI of 0.6%. For the year from September 2025, real hourly wages dropped 0.7%. Because workers put in more hours in September 2026 than in the same month in 2025, their weekly earnings fell only 0.1%.
High inflation is the culprit in this data. When real wages fall, potential home buyers have less money available for a home payment whether to rent or to own. Higher mortgage rates exacerbate the effect of inflation by demanding a higher payment for the same house from a household that is earning less money.
The search for an affordability solution continues. Captain Kirk and the crew of the Enterprise had an easier time finding “new life and new civilizations”.
USCB housing starts press releases are available back to 2016.